Showing UK postcode data on a map using Redash
May 23, 2018
As many of my readers will know I’ve recently become a fan of the reporting software https://redash.io. A lesser known fact is I’m also a big fan of big bolts. Whenever I’m out and about and I see a cracking bolt I like to take a photo, then like any self respecting bolt enthusiast I log the postcode of where I saw the bolt to my Postgres database.
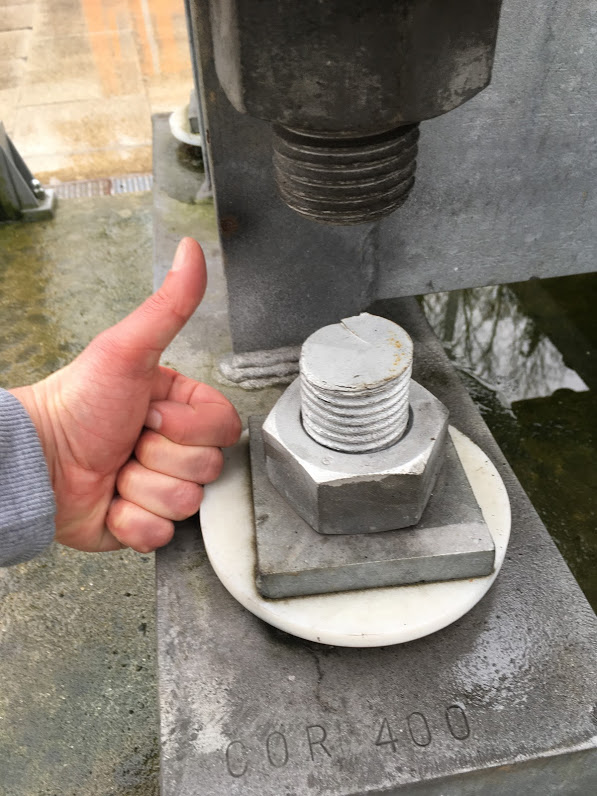
Above a photo of a cracking bolt I saw at Canonbury overground station.
Now one day it struck me that it would be great to plot the location of all these big bolts on a map so people could to do a bolt-based tour.
In this post I’ll explain how to create a map with Redash that can take data with postcodes from a Postgres table. None of the techniques in this post are bolt specific. This post has been written using Redash 3.0.0 and Postgres 9.5.6.
Mapping postcodes to longitude and latitude
The map functionality in Redash requires a latitude and longitude so you need to be able to map from a UK postcode to latitude and longitude coordinates. To do this download ukpostcodes.zip from freemaptools.com and unzip it, you now have a CSV file of the UK postcodes and their latitudes and longitudes.
Next login to your database using psql and create the table location:
CREATE TABLE location(
    id integer,
    postcode CHAR(10) NOT NULL,
    latitude decimal,
    longitude decimal
);
Next we populate the table with the postcode, latitude, longitude data from the CSV file we downloaded:
COPY location FROM 'ukpostcodes.csv' WITH (FORMAT csv);
For some locked down environments, like Heroku, you may need this alternative syntax to get round permission issues:
\copy location FROM 'ukpostcodes.csv' WITH CSV;
Our location table is now populated and we can map postcodes to latitude and longitude coordinates.
bolts=# select * from location;
   id    |  postcode  |      latitude      |     longitude
---------+------------+--------------------+--------------------
       1 | AB10 1XG   | 57.144165160000000 | -2.114847768000000
       2 | AB10 6RN   | 57.137879760000000 | -2.121486688000000
       3 | AB10 7JB   | 57.124273770000000 | -2.127189644000000
       4 | AB11 5QN   | 57.142701090000000 | -2.093295000000000
       5 | AB11 6UL   | 57.137546630000000 | -2.112233000000000
       6 | AB11 8RQ   | 57.135977620000000 | -2.072114784000000
       7 | AB12 3FJ   | 57.098002900000000 | -2.077438000000000
       8 | AB12 4NA   | 57.064272750000000 | -2.130018015000000
       9 | AB12 5GL   | 57.081937920000000 | -2.246567389000000
      10 | AB12 9SP   | 57.148707080000000 | -2.097806027000000
      11 | AB14 0TQ   | 57.101556920000000 | -2.268485752000000
      12 | AB15 5HB   | 57.147428000000000 | -2.147266200000000
      13 | AB15 6NA   | 57.151797000000000 | -2.185398000000000
      14 | AB15 8BA   | 57.135624220000000 | -2.175239142000000
      15 | AB15 8UF   | 57.154005960000000 | -2.224401880000000
      16 | AB15 9SE   | 57.118647620000000 | -2.174250607000000
      17 | AB16 5ST   | 57.163465880000000 | -2.159333430000000
      18 | AB16 6SZ   | 57.158751170000000 | -2.165214861000000
--More--
Pete, I hear you cry, this article started off really strong but you haven’t mentioned bolts for a number of paragraphs. Well you’re in luck now we’re going to create our boltmania table and insert some values:
CREATE TABLE boltmania(
    id integer,
    postcode CHAR(10) NOT NULL,
    rating CHAR(255) NOT NULL
);
INSERT INTO boltmania VALUES (1, 'N1 2PG', 'Helluva Bolt');
INSERT INTO boltmania VALUES (2, 'N1 2LW', 'Big boy bolt');
INSERT INTO boltmania VALUES (3, 'N1 4RA', 'Usain bolt');
INSERT INTO boltmania VALUES (4, 'N16 9EH', 'Probably the greatest bolt I''ve ever seen');
Now let’s write some SQL and make a map! Create a new query in Redash and enter the following:
SELECT boltmania.postcode,
       latitude,
       longitude
FROM boltmania,
     location
WHERE boltmania.postcode = location.postcode;
Now save your query and run it, you should see output like the image below:
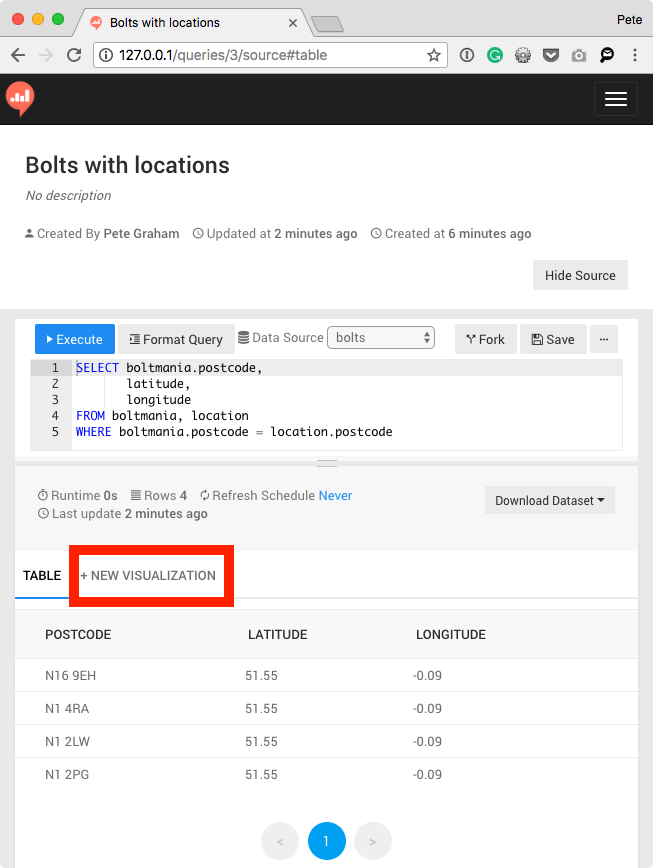
One thing to note is the Redash table UI limits the number of decimal places to 2 which is misleading. The more accurate longitude and latitude is there if you download the dataset.
Now click the “+ NEW VISUALIZATION” button, which is outlined in red on the screenshot above, then select:
- visualisation type: map
- Latitude Column Name: latitude
- Longitude Column Name: longitude Then click save
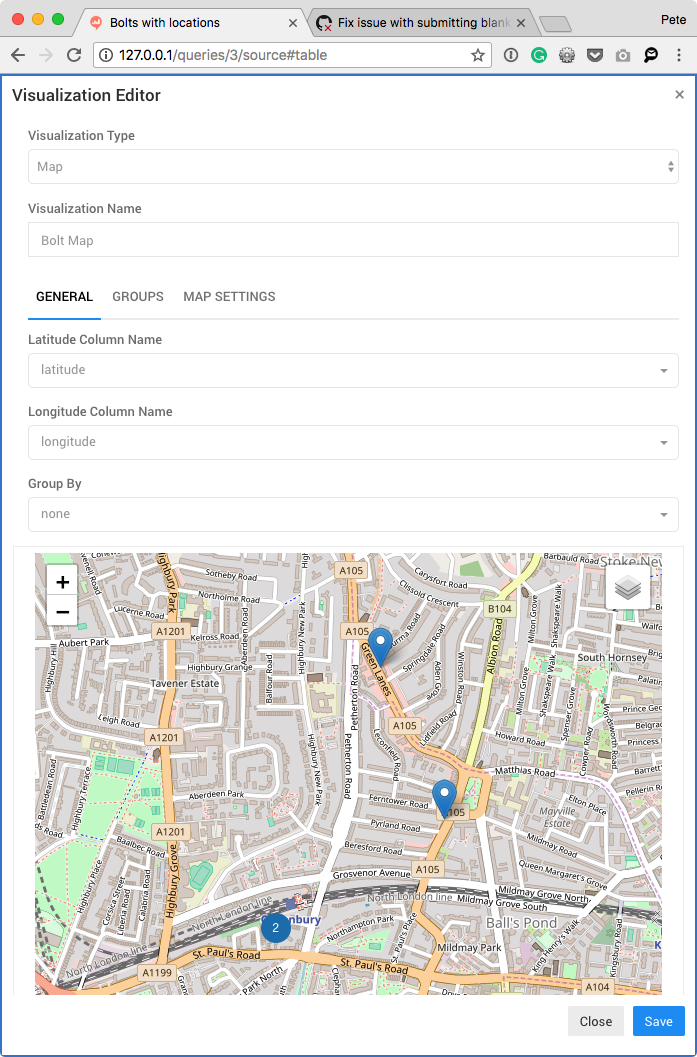
As you see we now have a cracking map showing you some of the best bolts in London. You luck lucky people!
Trade-offs
With all software development there are trade-offs with the design decisions you make. Here are those with the techniques in this article.
Storage of location data
Saving the location table data to your database will bloat it, an alternative would be to use Postgres Foreign Data Wrappers and keep the location data in a separate database which you can still run a join on. Alternatively you could just populate the location table with the values you need, using a script to call an API such as https://postcodes.io/ just for the postcodes we want.
Map interactions
The Redash map UI show pins on the map for each of your items and groups them dependent on the zoom level. If you wanted different interaction you may need to use an API such as the Google Maps API to build custom custom behaviour.
If you enjoyed this and want to try it out Redash read my running redash on macOs article.
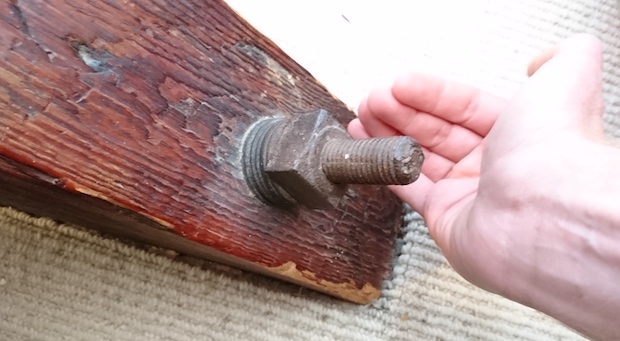
Thanks to Pete Goodman for correcting the spelling in this article, and more importantly sending me this photo of a marvellous bolt.
If you'd like to contact me then you can email writing@petegraham.co.uk or message me on BlueSky petexgraham.bsky.social.